

Migration Patterns, Migration Categories and Employment Outcomes

Changing Migration Patterns
Immigration has been integral to the development of Australia’s population, economy and society and Western Australia (WA) exemplifies not only the past success but also the future potential of Australia’s migration program and cultural diversity. Today, WA is the State with the highest proportion of migrants in its resident population, with around one in three people born overseas, compared with the Australian average of 27 per cent. Migrants and their children comprise more than 50 per cent of the State’s population. WA also has the fastest growing population of all the States and Territories: it increased by 2.9 per cent over the year to 31 December 2011 (60.9 per cent coming from overseas migration), compared with the Australian average of 1.4 per cent.
In terms of source countries of permanent settlers, WA continues to attract proportionally more people from the United Kingdom (UK) and South Africa than the Australian average. Over the past five years the proportion of Chinese intending to settle in WA has increased (from 2.4 per cent in 2006–7 to 4.6 per cent in 2010–11). Settlers from India, Malaysia, Vietnam and Singapore have remained in the top 10 source countries with India replacing Italy in the top five source countries. Between the 2006 and 2011 Censuses there has been an increase in the number and proportion (11.6 per cent to 14.5 per cent) of people speaking a language other than English (LOTE) at home. More than 325,000 people speak a LOTE at home.
The State’s share of the national population is projected by the ABS to grow to 11 per cent (3.0 million) by 2026 and 12 per cent (4.3 million) by 2056.
The economic returns from migration and cultural diversity are many and far-reaching. They include: an injection of skilled labour to WA’s workforce job generation economic growth a significant fiscal contribution increased productivity through innovation and business formation enhanced trade links and international markets supporting regional development and repopulation.

Recent analysis of the migration (including humanitarian) program has indicated that over the first 10 years of settlement, migrants will provide a net fiscal benefit of over $10 billion. For WA, the net fiscal contribution for their first year of settlement would be $355 million, comprising $115 million from permanent migration and $240 million from ‘457’ temporary visa holders.
In 2010–11, international education was Australia’s third largest export industry, generating over $15 billion, despite decreasing by 12.5 per cent from the previous year. Besides contributing directly through course fees, overseas students are entitled to work for up to 20 hours per week and spend money on essential goods and services. WA’s total value added was $795 million and this resulted in the employment of 6835 people.
The economic contribution of migrants also extends beyond the traditional supply and demand studies that have influenced the focus on skills in the Australian migration program. Researchers have argued that the congregation of people from diverse cultural backgrounds—and with a range of skills—stimulates new ideas, and that greater and more diverse concentrations of creative capital led to higher rates of innovation, and also high technology, business formation, job generation and economic growth.
For the past 20 years, successive Australian governments have recognised the benefits of tapping the education, language and cultural skills and knowledge of migrants. The reality remains that global trade and the migration of workers will continue to shape the environment in which Australian, and Western Australian companies operate. In this context the cultural diversity of the Australian workforce, and particularly the WA workforce, will only increase.
The challenges and opportunities of ‘the Asian Century’ are more obvious for WA than for any other State. Today, seven out of 10 of WA’s major trading partners are in Asia, with growing trade links to Africa. In 2011, China was WA’s largest export market ($52.6 billion, or 43 per cent). China was also the State’s third largest source of imports. In importance of export markets, China is followed by Japan ($22.7 billion or 19 per cent), South Korea ($10.5 billion or 9 per cent) and India ($5.4 billion or 4.5 per cent).
More than 160 Western Australian companies are involved in Africa, reflecting an increasing interest in the region (Intierra 2012). In 2011, more than 130 Western Australian mining companies were active in 415 projects across 42 African countries—this represented more than 70 per cent of all Australian Stock Exchange listed companies involved in Africa’s resources sector.
WA’s diversity has contributed to the State in ways beyond those measurable in direct economic terms. It has enriched the cosmopolitan vibrancy of Perth as shown by its residents’ choices of food, as well as artistic, recreational, and cultural pursuits. WA’s diversity will attract further migration: international as well as interstate, temporary workers as well as permanent settlers, tourists, and students as well as business visitors and investors. It will help to consolidate our links with our neighbours, and with the rest of the world.
Reference: The Economic and Social Contribution of Migrants to Western Australia, 2012. Office of Multicultural Interests, Department of Local Government. Gordon Stephenson House, 140 William Street PERTH WA 6000. Pages 5 – 6.
Migration Categories

The most direct and obvious economic contribution of skilled migrants comes from their employment, from the role they play in filling job vacancies and from the way they reduce skill ‘bottlenecks’. It comes from the skills, qualifications and work experience for which they have been selected, through the permanent migration program, or through one of the many temporary work or business programs.
It is significant that not only has there been a policy shift in the permanent program towards skilled migrants, but there has also been a dramatic increase in the number of skilled migrants coming under temporary skilled programs. These programs aim to provide flexibility to respond to labour demands and shortages.
The migration program’s visa categories and sub-categories, and the numbers of visas issued within them, reflect this focus. The figure below sets out Australia’s migration programs and its categories in a schematic way, showing both permanent program outcomes and temporary resident visas for 2009–10 and for 2010–11. It also provides information for the two other permanent entry streams—New Zealand residents and humanitarian entrants. (The humanitarian program is not based on the potential economic contribution of applicants, but on their humanitarian need.)
Permanent Outcomes and Temporary Entry Visa Grants 2009 – 2011
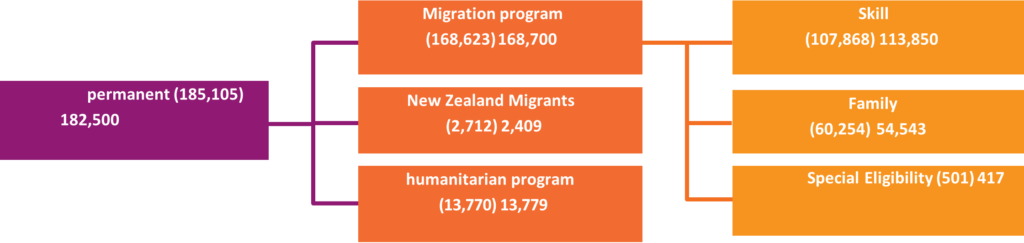
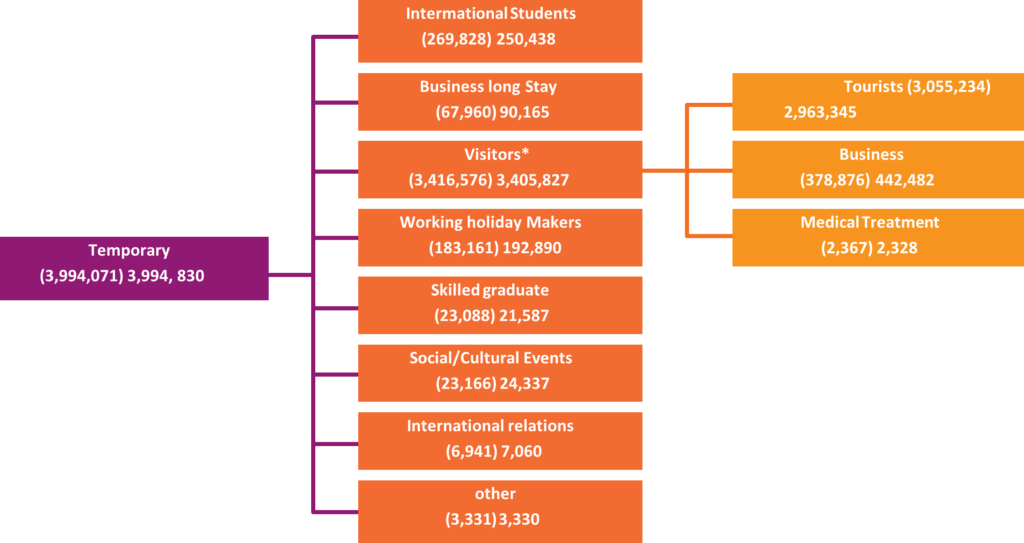
* Excludes 28,644 visitor visas granted onshore – to prevent double counting from visa renewals. Source: Population Flows 2011 and DIAC’s 2012 report to the OECD. (Page 17).
Note: ‘International students’ are student visa-holders.
Skilled
As described above, the focus of Australia’s migration program in recent decades has been squarely on the labour market, to obtain needed skills and fill job vacancies. In 2010–11, 113,725 migrants arrived as skilled, permanent migrants. The top 10 source countries were China (20,441), the UK (18,091), India (17,331), the Philippines (7849), South Africa (7959), Malaysia (4192), Sri Lanka (3846), South Korea (3282), Ireland (2934) and Iran (1813).
General
General skilled migrants are those who apply to come independently and meet the requirements of the points test. They may gain extra points if they are sponsored by either a State or Territory government, or by other skilled family members already resident in Australia. In 2010–11, 36,167 persons came as independent migrants (without sponsorship), 16,175 came with a State or Territory sponsorship, and 9117 came with a skilled family sponsorship.
Employer-sponsored
Employer-sponsored skilled migrants are those who are sponsored by employers. These migrants have jobs waiting in Australia. They still must meet points, health and character requirements. In 2010–11, 44,345 skilled migrants were employer-sponsored.

Business
The business skills program aims to attract overseas business owners, senior executives or investors. People applying for a visa in this category are generally granted an initial four-year visa, during which time they can apply for a permanent visa. Business skills applicants generally have to show that they can establish a business in Australia that will develop links with international markets, produce goods and services that otherwise would be imported, introduce new and/ or improved technology, and add to the commercial activity and competitiveness within sections of the Australian economy. In 2010–11, some 7800 business visas were granted in Australia. Nearly two-thirds of these went to people from China. Other Chinese from Hong Kong (120), Malaysia (414), Singapore and Taiwan were prominent in obtaining business visas.
WA received 22,047 skilled stream permanent migrants in 2009–10 and another 19,715 in 2010–11. Over half of these came under employer- sponsored programs in 2010–11. Other major skilled visa categories were skilled independent (23 per cent), skilled Australia linked and skilled family sponsored.
It is interesting to note that less than one per cent of permanent business visa holders (616) settled in WA out of the 7800 business visas issued in Australia in 2010–11. Over 75 per cent of business visa migrants settled in NSW, primarily Sydney. The great majority were Chinese, from China, Hong Kong, Malaysia and Taiwan. They were attracted to Sydney because of the long history of Chinese settlers, the large numbers of Chinese business ventures and family ties. As the Chinese community grows in WA, it should attract further business skills migration.
More than two-thirds of skilled stream permanent migrants to WA were born in one of five countries— the UK (24 per cent), South Africa (17 per cent), India (11 per cent), the Philippines (10 per cent) and China (8 per cent). It should be noted that permanent additions do not include the large numbers of skilled New Zealanders who come under special arrangements as skilled settlers.
Family migration

As with the skills categories, Asia-born migrants comprise six out of the top 10 source countries in the family categories. In descending order the main source countries are China (16.6 per cent), the UK (11 per cent), India (8.1 per cent), Vietnam (6.1 per cent) and the Philippines (5.4 per cent).
In 2010–11, there were 12.6 per cent more females than males in the permanent migration program. The main reason for this is the predominance of females in the family stream. Females access the majority of family stream places, as this stream mostly comprises partner visas and females tend to apply for these visas more often than males.
Within the skill stream, there were 11.3 per cent more males than females. This is partly because skilled male primary applicants outnumbered skilled female applicants by about two to one. This male over- representation is partly offset because the spouses of skilled primary applicants are mainly female.
Of the 54,500 family entrants settling in Australia in 2010–11, some 7000 settled in WA. The UK accounted for around 19 per cent of these migrants. Other major source countries were India, China, Thailand and the Philippines. Of these family visas, more than two-thirds were dependant spouses, and 12 per cent were fiancée visas. Another 12 per cent were parent visa categories.
The Humanitarian Program

Humanitarian entrants, beginning with the arrival of displaced people from postwar Europe, were counted as part of the general annual migration program until the late 1970s, when refugees started arriving from countries within the region. Since 1978, Australia has had a separate permanent Humanitarian Program, under which different criteria apply. People have been settled not on the basis of their labour-market or economic potential, but on the basis of their need for a safe haven. Source countries and regions have changed over the years. In the late 1970s and 1980s, many came from Vietnam, Laos and Cambodia, with a significant number from Eastern Europe. In more recent years, the main source regions and countries have been the Middle East and Africa, as well as Asia. Refugees who come from refugee camps near their countries of origin are selected by the Australian Government in conjunction with the UNHCR.
In 2010–11 some 13,779 humanitarian visas were issued, 8971 from offshore resettlement (that is, chosen from camps), and 4808 from onshore asylum seekers assessed as requiring Australia’s protection. Of the onshore asylum seekers, 2700 were irregular maritime arrivals (IMAs) and 2108 were ‘other’ (mainly visa over-stayers who arrived as visitors or students). The top 10 source countries for offshore visas were Burma (Myanmar), Iraq, Bhutan, Afghanistan, the Republic of the Congo and the Democratic Republic of Congo, Ethiopia, Somalia, Sudan, Liberia and Sierra Leone. The top five source countries for irregular maritime arrivals (IMAs) who received protection visas were Afghanistan, Sri Lanka, ‘Stateless’, Iraq and Iran. The top five source countries for ‘others’ who received protection visas in 2010–11 were China, India, Pakistan, Iran and Egypt.
Population Flows 2011 records WA as receiving 2248 humanitarian entrants in 2010–11. This was 17 per cent of the total humanitarian intake that year. Of these, 1431 were granted visas onshore (IMAs and ‘others’) and 817 were offshore humanitarian entrants, either refugees (517) or special humanitarian entrants (300). Some 60 per cent of the humanitarian entrants who settled in WA in 2010–11 were born in three countries: Afghanistan (32 per cent), Iraq (16 per cent) and Sri Lanka (13 per cent).
Reference: The Economic and Social Contribution of Migrants to Western Australia, 2012. Office of Multicultural Interests, Department of Local Government. Gordon Stephenson House, 140 William Street PERTH WA 6000. Pages 16 – 20.
Employment Outcomes
Research by Dr Thomas Liebig of the OECD on the Labour Market Integration of Immigrants in Australia concluded: ‘Migrants in Australia, as a whole enjoy much better labour market outcomes than migrants in all other (OECD) countries. It has the lowest migrant unemployment rates in absolute terms, and the lowest rates compared to native-born populations.’
In August 2011, the Australian Bureau of Statistics (ABS) recorded the Australian labour force as comprising some 12.07 million people ‘of which some 3.32 million were overseas-born and 1.34 million from the mainly English speaking countries (MESC) of New Zealand, Canada, USA, UK, South Africa and Ireland. The remaining 1.98 million migrants were from non-English speaking countries (NESC).
Table 5, based on the ABS Labour Force Survey of August 2011, shows the labour force status of these groups at that time.
Table 5: Employment Status of civilian population aged 15 years or more, by birthplace, 2010–11
| Category | Employment rate (%) | unemployment rate (%) | participation rate (%) |
| Australian born males | 71.1 | 5.0 | 74.8 |
| Australian born females | 59.2 | 5.1 | 62.4 |
| Australian born | 65.1 | 5.0 | 68.6 |
| MESC born males | 71.7 | 3.9 | 74.6 |
| MESC born females | 58.5 | 5.0 | 61.6 |
| MESC born | 65.3 | 4.4 | 68.2 |
| NESC born males | 63.5 | 4.9 | 66.8 |
| NESC born females | 47.6 | 6.6 | 51.0 |
| NESC born | 55.3 | 5.6 | 58.6 |
| Total overseas-born | 63.3 | 5.1 | 66.6 |
Source: Labour Force, Australia (6291.0), ABS. (Page 24).
Table 5 shows that:
- Australia-born and MESC migrants are more strongly represented in the workforce than are NESC migrants
- MESC migrants have the lowest unemployment rates, and NESC have the highest unemployment rates
- The female participation rate for NESC migrants (51 per cent) is considerably below female MESC migrants (68 per cent) and Australia-born females (69 per cent).
The poorer employment and participation outcomes for NESC migrants overall is because of the large numbers of NESC migrants entering under the humanitarian and dependant family categories which are not based on skill levels.
Table 6: Occupation by birthplace, August 2011
| Occupation | Australia (%) | MESC (%) | NESC (%) | overall (%) |
| Managers | 13.1 | 15.1 | 11.0 | 13.0 |
| Professionals | 20.0 | 25.7 | 25.6 | 21.6 |
| Technicians and Trade Workers | 14.8 | 13.9 | 12.0 | 14.2 |
| Community and Personal Service | 9.9 | 8.6 | 9.6 | 9.7 |
| Clerical and Administrative Workers | 15.6 | 14.7 | 12.9 | 15.1 |
| Sales Workers | 10.2 | 6.9 | 7.6 | 9.4 |
| Machinery operators and drivers | 6.8 | 6.9 | 6.9 | 6.8 |
| Labourers | 9.6 | 8.2 | 14.4 | 10.3 |
| Total | 100.0 | 100.0 | 100.0 | 100.0 |
Source: DIAC, 2012, Trends in Migration, Australia, 2010–11. Page 96.
Table 6 indicates that both NESC and MESC migrants are more likely to be employed in professional occupations than are the Australia-born. MESC migrants are also more likely, due to the skills focus of the migration program, to be employed as managers than NESC migrants or the Australian-born. Also, NESC migrants are significantly over-represented in lower-skilled jobs.
Table 7: Industry by birthplace, August 2011
| Industry | Australia (%) | MESC (%) | NESC (%) | Total (%) |
| Agriculture, Forestry and Fishing | 3.4 | 1.3 | 1.1 | 2.8 |
| Mining | 2.1 | 3.2 | 0.8 | 2.0 |
| Manufacturing | 7.7 | 8.3 | 11.0 | 8.3 |
| Electricity, gas and Water Supply | 1.3 | 1.2 | 1.1 | 1.2 |
| Construction | 9.7 | 9.8 | 6.0 | 9.1 |
| Wholesale Trade | 3.4 | 3.6 | 4.2 | 3.6 |
| retail Trade | 11.4 | 8.3 | 9.5 | 10.8 |
| Accommodation and Food Services | 6.4 | 4.7 | 10.4 | 6.9 |
| Transport postal and Warehousing | 5.0 | 5.1 | 5.7 | 5.1 |
| Information Media and Telecommunications | 1.7 | 2.1 | 1.9 | 1.8 |
| Finance and Insurance Services | 3.6 | 4.7 | 4.1 | 3.8 |
| rental, hiring and real Estate Services | 1.8 | 2.0 | 1.2 | 1.7 |
| professional, Scientific and Technical Services | 7.0 | 9.9 | 9.5 | 7.7 |
| Administrative and Support Services | 3.2 | 4.0 | 5.0 | 3.6 |
| public Administration and Safety | 7.0 | 5.5 | 5.0 | 6.5 |
| Education and Training | 8.0 | 8.6 | 5.6 | 7.6 |
| health Care and Social Assistance | 11.1 | 12.2 | 13.6 | 11.7 |
| Arts and recreation Services | 2.0 | 1.9 | 1.1 | 1.8 |
| other Services | 4.1 | 3.9 | 3.6 | 4.0 |
| Total | 100.0 | 100.0 | 100.0 | 100.0 |
Source: DIAC, 2012, Trends in Migration, Australia, 2010–11. Page 96.
Table 7 shows that NESC migrant workers are over- represented in the health care and social assistance, accommodation and food services, and manufacturing industries. They are under-represented in construction, public administration, and safety and educational training industries. MESC migrant workers are notably over-represented in mining and construction. Less than one per cent of NESC workers are in mining jobs.
All migrants have higher representation in professional, scientific and technical services, but are significantly under-represented in the agriculture sector.
The Fiscal Contribution of Migrants—WA
Table 11: Fiscal Contribution of WA Migrants 2010–11 (A$ million)
| Visa grants 2010-11 | Net Fiscal Impact (1st. year) | |||
| Visa Category | Australia (number | WA number (per cent) | Australia (A$ million) | WA (A$ million) |
| Family | 54,500 | 7,100 (13%) | 212.3 | 27.5 |
| Skill | 113,700 | 19,700 (17%) | 747.4 | 127.0 |
| humanitarian | 13,800 | 2,200 (16%) | -247.3 | -29.5 |
| Total Fiscal Impact | 712.4 | 115.0 | ||
| Temporary long Stay Business (457 visas) | 90,100 | 24,500 (27%) | 889.3 | 240.0 |
Source: DIAC, 2012, Trends in Migration, Australia, 2010–11. Page 97.
Table 11 is based on the numbers of migrants in each visa category who entered in 2010–11 and who indicated their intention to reside or settle in WA.
The table shows that migrants (including humanitarian and temporary) who came to WA in 2010 provided a total net fiscal contribution for their first year of settlement of $355 million, comprising $115 million from permanent migration and $240 million from ‘457’ temporary visa holders.
According to the Access Economics model, the 19,700 skilled permanent migrants who entered WA in 2010–11 contributed $127 million to the Australian Government’s budget in their first year of settlement.
Reference: The Economic and Social Contribution of Migrants to Western Australia, 2012. Office of Multicultural Interests, Department of Local Government. Gordon Stephenson House, 140 William Street PERTH WA 6000. Pages 24 – 26