

Tobacco Smoking In Australia – 2019

Tobacco smoking is the leading cause of preventable disease and death in Australia. In 2015, it was responsible for 9.3% of the total burden of disease and injury, and more than 1 in every 10 (21,000) deaths.
In 2015–16, tobacco smoking was estimated to cost Australian society $137 billion, comprising $19.2 billion in tangible costs (such as health care, reduced workplace productivity and caring for someone with a smoking‑related disease), and $118 billion in intangible costs (such as pain and suffering caused by ill health attributed to smoking).
How many people smoke and how has this changed?
Since 1991, the proportion of daily smokers has more than halved (Figure 2.1) while the proportion never taking up smoking has increased (from 49% in 1991 to 63% in 2019). The proportion of ex-smokers has remained stable over this period and did not change between 2016 and 2019 (23%).
In 2019, 11.0% of people aged 14 and over smoked daily, declining from 12.2% in 2016. This equates to a reduction of about 100,000 daily smokers over the 3 years (from about 2.4 million to 2.3 million Australians).
The decrease in daily smoking appears to be mainly driven by fewer people aged 14–39 taking up smoking between 2001 and 2019. For example, the proportion of young adults aged 18–24 never smoking more than 100 cigarettes in their life has increased from 58% to 80% between 2001 and 2019, while the proportion of people in their 50s increased only from 44% to 51%.
Among current smokers, people smoked an average (mean) of 13 cigarettes per day in 2019—declining from 16 cigarettes per day in 2010. The proportion of pack-a-day (20 cigarettes or more) smokers also fell over this period, from 44% in 2010 to 33% in 2019.
Daily smoking proportions were as low as 3.3% in Northern Sydney and as high as 17.4% in Northern Queensland. After adjusting for differences in age, Northern Sydney continued to have the lowest daily smoking rate at 3.3% and Gippsland had the highest at 20%.

Who is most likely to smoke?
As in previous surveys, males (12.2%) were more likely to smoke daily than females (9.9%) in 2019. However, the gap has narrowed slightly since 2016 when 13.8% of males were daily smokers compared with 10.7% of females.
Between 2016 and 2019, the proportion of people who smoked daily fell for people in their 20s, 30s and those aged 70 and over, driven largely by the declining proportion of male smokers. There were no statistically significant changes in the proportion of females smoking daily across any age group between 2016 and 2019; however, the proportion of women in their 20s and 30s reporting that they had never smoked increased (from 73% to 77%, and 62% and 67%, respectively).
People in their 40s (15.8%) and 50s (15.9%) were most likely to smoke daily in 2019. Among males, people in their 40s were the most likely to smoke daily (18.4%); for females, it was those in their 50s (15.2%).
The proportion of teenagers aged 14–19 who smoked daily remained low in 2019 and has fallen by about 80% since 2001.
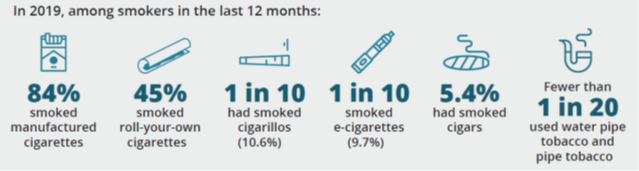
More smokers are opting for roll-your-own cigarettes, either in combination with manufactured cigarettes or exclusively roll-your-own cigarettes—overall use rose from 26% in 2007 to 36% in 2016 and 45% in 2019 (Table 2.16). The rise was greatest among young adult smokers aged 18–24 (up from 28% in 2007 to 63% in 2019), the age group most likely to smoke these cigarettes.
The overall changes in the use of these products were largely driven by people using a combination of manufactured and roll-your own cigarettes, which increased from 26% in 2016 to 33% in 2019). There was also an increase in the proportion of people using exclusively roll-your-own cigarettes, from 10.7% in 2016 to 13.9% in 2019. The increase among young adult smokers aged 18–24, however, was driven by an increase in people smoking only roll-your-own cigarettes (from 12.0% in 2016 to 21% in 2019). The increase in use of roll-your-own cigarettes is likely to be partly due to cost— roll-your-own cigarettes may be cheaper (for example, due to the availability of smaller pouch sizes) than manufactured cigarettes. Smokers of roll-your-own cigarettes can also control the amount of tobacco per cigarette and roll smaller cigarettes to reduce their costs.
Declines in daily smoking in highest socioeconomic areas
Compared with 2016, there were declines in the proportion of people who smoked daily who lived in the second highest (10.1% compared with 7.9% in 2019) and highest socioeconomic areas (6.5% compared with 5.0%). Since 2010, there were declines in daily smoking across all socioeconomic areas (Table 7.18).
Daily smoking highest in lowest socioeconomic areas
After adjusting for age, daily smoking was about 3.7 times higher among people living in the lowest socioeconomic areas than people living in the highest socioeconomic areas (19.0% compared with 5.1%).
How many smokers try to quit or reduce their smoking?
Questions about quitting and reducing smoking are asked only of smokers who reported smoking in the previous 12 months. In 2019, 3 in 10 (31%) smokers tried to quit but were not successful (Table 2.39), 2 in 10 (21%) were able to quit for more than a month (up from 17.2% in 2016) and 4 in 10 (39%) reduced the amount of tobacco smoked in a day in the previous 12 months. More smokers said the cost of smoking was motivating them to quit or cut back—58% in 2019 compared with 52% in 2016—and nearly half (45%) were motivated to try quitting due to the effect smoking was having on their health or fitness.
The majority (61%) of smokers tried to undertake at least 1 activity to help quit smoking in 2019, including:
- by going ‘cold turkey’ (that is, they just stopped smoking (23%))
- discussing smoking and health at home (22%)
- using nicotine gum, nicotine patch, inhaler or spray (16.8%)
- asking their doctor for help to quit (10.2%).
Why don’t smokers quit?
While most smokers (63%) would like to quit smoking and intend to, some may have no interest in giving up smoking. In 2019, 3 in 10 smokers said they did not intend to quit and this proportion has not changed over the last decade.

Reference: Australian Institute of Health and Welfare 2020. National Drug Strategy Household Survey 2019. Drug Statistics series no. 32. PHE 270. Canberra AIHW. Pages 5 – 59.