
Illicit Drug Use in Australia – 2019

Harms from illicit drugs affect all Australian communities, families and individuals, either directly or indirectly. These include illnesses and injuries, mental health and trauma, and health care and other financial costs.
In 2015, illicit drug use contributed to 2.7% of the total burden of disease and injury. In 2018, 1,740 deaths were directly attributable to drug use, and opioids were present in nearly two-thirds of these deaths (64.5% or 1,123 deaths).
What is meant by ‘illicit drug use’?
- use of illegal drugs (such as meth/amphetamines and cocaine)
- use of pharmaceuticals for non-medical purposes (for example, using oxycodone or benzodiazepines without a prescription, or in a quantity or for a purpose for which it is not intended)
- volatile substances used inappropriately (for example, inhalants such as petrol or glue).
How many people use illicit drugs and how has this changed?
In 2019, 9.0 million (or 43%) people aged 14 and over in Australia had illicitly used a drug at some point in their lifetime (including pharmaceuticals used for non-medical purposes) and 3.4 million (or 16.4%) had used one in the last 12 months (tables 4.1, 4.3, 4.7, and 5.5). This was like the proportions in 2016 but has increased since 2007 (38% and 13.4% respectively).
There were several changes in lifetime and recent use of specific drugs between 2016 and 2019:

How has illicit drug use changed across age groups?
In 2001, use of an illicit drug in a person’s lifetime was highest among people in their 20s (Figure 4.1). By 2019, it was people in their 40s who were the most likely to have ever used an illicit drug. Over the last 18 years, both lifetime and recent use have risen among older age groups, remained stable for people in their 30s and generally declined among people aged under 30 (14–29 years).
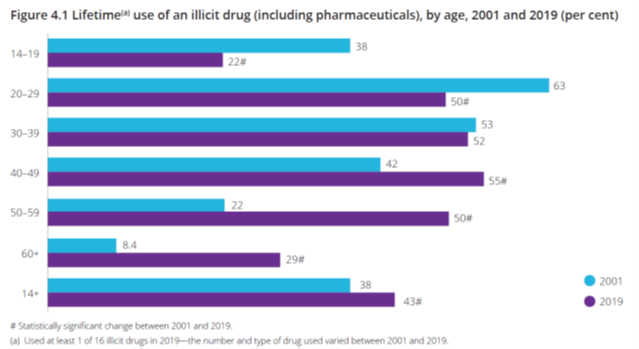
Over the most recent 3-year period, the proportion of people aged 60 and over who had ever used an illicit drug increased. This pattern was seen for both males and females. This could be due in part to people who used illicit drugs ageing. Trends in drug use can also result from generational differences in drug use and changes in the composition of the population over time, such as the ageing of a particular generation of people.
When looking at illicit drug use excluding pharmaceuticals, males in their 20s and 30s reported increases in recent use between 2016 and 2019. Females in their 50s and those aged 60 and over reported small increases in recent use.
The average age at which some people use drugs has risen
Although no statistically significant changes were detected in the median age of people who used drugs between 2016 and 2019, the median age of people who use drugs for most illicit drugs has risen since 2001. For example:
- the median age of people who used cannabis was 26 in 2001 and increased to 31 in 2019
- the median age of people who used cocaine was 25 in 2001 and rose to 28 in 2019
- people who used meth/amphetamine are nearly a decade older, on average, than they were in 2001—increasing from 23 years old in 2001, to 32 by 2019.
People using ecstasy and hallucinogens in the past 12 months were generally younger than people using cannabis and meth/amphetamines (mid-20s compared with early 30s).
Of people aged 14 and over who have used illicit drugs in their lifetime, most first tried them in their 20s, with some drugs tried earlier than others. The age at which people first tried drugs was similar in 2016 and 2019 but in comparison to 2001, people were generally older.

Among people aged 14–29, the mean age of initiation of illicit drug use rose from 16.7 years in 2016 to 17.3 years in 2019 (Table 4.18). This was due to 14–29-year old’s delaying their uptake of cannabis, ecstasy, inhalants, painkillers and opioids, and tranquillisers.
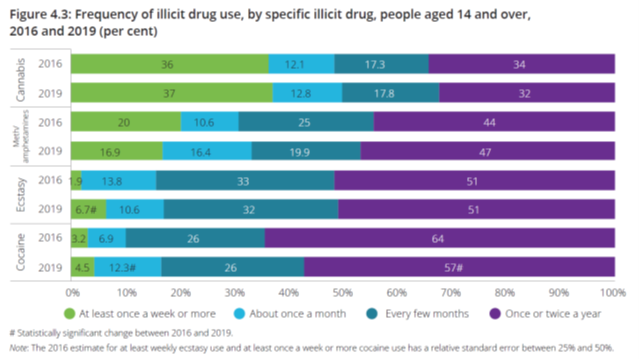
Which illicit drugs are used most frequently?
Some drugs are used much more often than others, and the health risks of illicit drug use vary with the frequency, type and quantity of drugs used (Degenhardt et al. 2013). The NDSHS results show that cannabis and meth/amphetamines are used much more frequently than cocaine and ecstasy (Figure 4.3). In 2019, people who used cannabis or meth/amphetamines were much more likely to use the drug regularly, with 37% and 17% respectively using as often as weekly or more compared with those who used ecstasy or cocaine (6.7% and 4.5% respectively). However, there were more people using ecstasy at least weekly in 2019 than in 2016, and more people were using cocaine about once a month, but fewer using it once or twice a year.
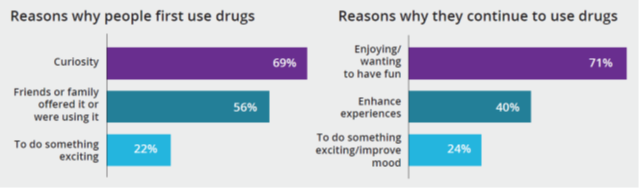
Why do people decide to use illicit drugs?
The decision to use drugs for the first time and to continue using them is influenced by a number of factors. There are different categories of drug use including experimental use (trying it once or twice out of curiosity), recreational use (for enjoyment, to enhance a mood or social occasion), situational use (to cope with the demands of a situation) and dependent use (needing it consistently to feel normal or avoid withdrawals). It can be difficult for a person to identify the reasons they may take drugs, or they may answer in a way they deem to be more socially acceptable. In 2019, people were asked why they first decided to use drugs, and if they continue to use them, the reasons that they do.
Most people who have not tried illicit drugs are not interested
In 2019, around 3 in 4 (73%) people who had never used illicit drugs had not tried them because they were not interested, and this has not changed since 2010. A further 44% said they had never tried them as they were concerned about their health or becoming addicted and about 1 in 3 (32%) were worried about the legal consequences and did not want to break the law.
More people experienced drug-related harm
The survey asks people if they have experienced verbal abuse, physical abuse or have been put in fear by someone they suspect is under the influence of illicit drugs. In 2019, more people were victims of an incident related to illicit drugs in the previous 12 months than in 2016—the proportions of people experiencing verbal abuse, physical abuse and being put in fear all increased, driven by increases among males and people in their 30s, 50s, and aged 60 and over. The number of people reporting that they had been a victim of an illicit drug-related incident increased from about 1.8 million in 2016 to 2.2 million in 2019.

How does drug use vary by socioeconomic area?
Although the average overall level of health and wellbeing of the Australian population is high when compared with the populations of other countries, there are substantial differences in the health of specific groups within the population.
Social and economic factors shape risk behaviour and the health of people who used drugs. They affect health indirectly by shaping individual drug-use behaviour, and directly by affecting the availability of resources, access to social welfare systems, marginalisation and compliance with medication. In this report, the Index of Relative Socio-economic Advantage and Disadvantage (IRSAD) is used to classify individuals according to the socioeconomic characteristic of the area in which they live. It scores each area by summarising attributes of the population, such as income, educational attainment, unemployment rate and jobs in skilled or unskilled occupations.
The areas are grouped into quintiles, and the 20% of the areas with the greatest overall level of disadvantage is described as the ‘lowest socioeconomic area’. The 20% of the areas with the greatest overall level of advantage—the top fifth—is described as the ‘highest socioeconomic area’.
Note that the IRSAD reflects the overall or average level of advantage and disadvantage of the population of an area; it does not show how individuals living in the same area differ from each other in their socioeconomic position.
Illicit drug use increases in highest socioeconomic areas
Levels of recent illicit drug use increased in areas of highest socioeconomic advantage (from 14.1% in 2016 to 18.1% in 2019). This change has been driven by a rise in the use of cannabis (from 9.4% to 12.4%), ecstasy (from 2.7% to 4.8%) and cocaine (from 3.3% to 6.9%). Conversely there was a decline in the use of painkillers/pain-relievers and opioids (2.6% in 2016 compared with 1.8% in 2019).
In the lowest socioeconomic areas, there were several changes in the type of drug recently used, including:
- an increase in ecstasy (from 1.2% in 2016 to 2.0% in 2019) and cocaine (1.2% to 2.5%)
- a decrease in painkillers/pain-relievers and opioids (from 4.8% in 2016 to 3.0% in 2019)
Greater cocaine and ecstasy use in highest socioeconomic areas
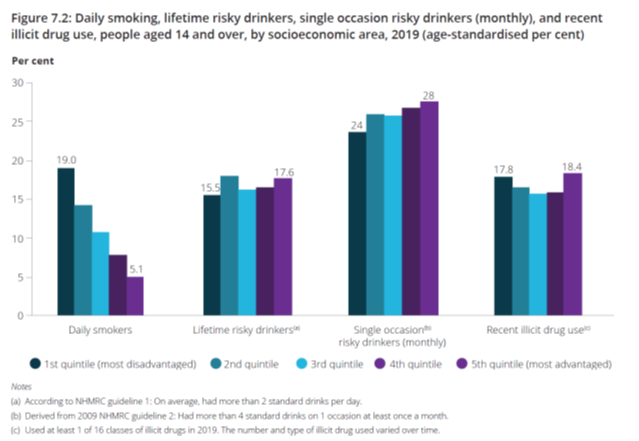
After adjusting for age, levels of use of any illicit drug in the last 12 months were similar in the lowest socioeconomic areas and the highest (17.8% compared with 18.4%), but the type of drug used varied. People living in the highest socioeconomic areas were:
- more likely to have recently used ecstasy (4.8% compared with 2.1%) and cocaine (7.1% compared with 2.6%)
- less likely to have used painkillers and opioids in the last 12 months (1.8% compared with 3.0%), than people living in the lowest socioeconomic areas
How does drug use vary across Primary Health Network areas?
Primary Health Networks (PHNs) are organisations that connect health services over local geographic areas according to boundaries defined by the Department of Health. There are 31 PHNs in Australia.
Across PHNs there was wide variation in the use of tobacco, alcohol and illicit drugs in 2019.
- Across Australia, Northern Sydney (11.0%) had the lowest proportion of people who used illicit drugs in previous 12 months while North Coast (NSW) had the highest (23%). After adjusting for differences in age, North Coast continued to have the highest proportion of people who used illicit drugs (26%) and Western Sydney had the lowest (9.5%).
Reference: Australian Institute of Health and Welfare 2020. National Drug Strategy Household Survey 2019. Drug Statistics series no. 32. PHE 270. Canberra AIHW. Pages 22 – 62.