Australian’s Drug Use
Tobacco, alcohol and illicit drug use can place a heavy burden on individuals, families and society. The health, social and economic effects are diverse and substantial, and include disease and injury, mental health conditions, road accidents, family and domestic violence, and other crime.
This report presents key results from the 2019 National Drug Strategy Household Survey. It looks at people’s drug use throughout their lives and during the last 12 months, and examines how these patterns have changed over time. It also asks people for their opinions on a range of initiatives designed to reduce the harm caused by tobacco, alcohol and illicit drug use, and for the first time provides perspectives on emerging initiatives, such as the availability of pill and other drug testing for potential drug users.
Fewer Australians are smoking tobacco
In 2019, 11.0% of Australians smoked tobacco daily, down from 12.2% in 2016 and 24% in 1991. These falls were mainly driven by younger generations not taking up smoking.
Many smokers were taking steps to reduce their tobacco consumption in 2019. Around 2 in 5 (39%) said they had cut back on the amount of tobacco smoked per day over the past 12 months. In 2019, a smoker would smoke, on average, 13 cigarettes per day, down from 16 in 2010. Almost 3 in 5 (58%) smokers said the cost was motivating them to quit or cut back, up from around 1 in 2 (52%) in 2016.

Roll-your-own and e-cigarettes use is increasing
While fewer Australians were smoking in 2019, 45% of smokers used roll-your-own cigarettes, up from 36% in 2016. One-third (33%) of smokers smoked roll-your-own cigarettes in combination with manufactured cigarettes (up from 26% in 2016), and 13.9% smoked roll-your-own cigarettes exclusively (up from 10.7% in 2016).
Use of e-cigarettes is also becoming more common. Between 2016 and 2019, the proportion of people who had ever used e-cigarettes rose from 8.8% to 11.3%. While use of e-cigarettes rose across most age groups, the rise among young adults was particularly notable. Nearly 2 in 3 (64%) current smokers and 1 in 5 (20%) non-smokers aged 18–24 reported having tried e-cigarettes. Among those who had tried them, frequency of use also increased, with more people using them at least monthly (from 10.3% in 2016 to 17.9% in 2019).
More Australians are giving up or reducing their alcohol intake, driven by health concerns
Between 2016 and 2019, the proportion of ex-drinkers rose from 7.6% to 8.9%. There was also a rise in the number of people cutting back on alcohol, with 31% of people saying they had reduced the number of alcoholic drinks they consumed at any 1 time, up from 28% in 2016. The main reason people gave for reducing their intake was ‘health reasons’ (such as weight loss or avoiding hangovers).
Despite this, there has been little change in the proportion of people drinking at risky levels. In 2019, 1 in 4 (25%) people drank at a risky level on a single occasion at least monthly, while about 1 in 6 (16.8%) exceeded the lifetime risk guideline. While the proportion exceeding the single occasion risk and lifetime risk guidelines has remained stable in recent years, it has improved since the guidelines were introduced in 2009 (was 29% and 21% respectively in 2010).
More than 2 in 5 Australians have used an illicit drug in their lifetime, and recent cannabis use has increased
In 2019, 43% of Australians aged 14 and over had illicitly used a drug at some point in their life (including pharmaceuticals used for non-medical purposes) and 16.4% had used one in the last 12 months. This has been fairly stable since 2016, but up from 38% and 13.4% in 2007.
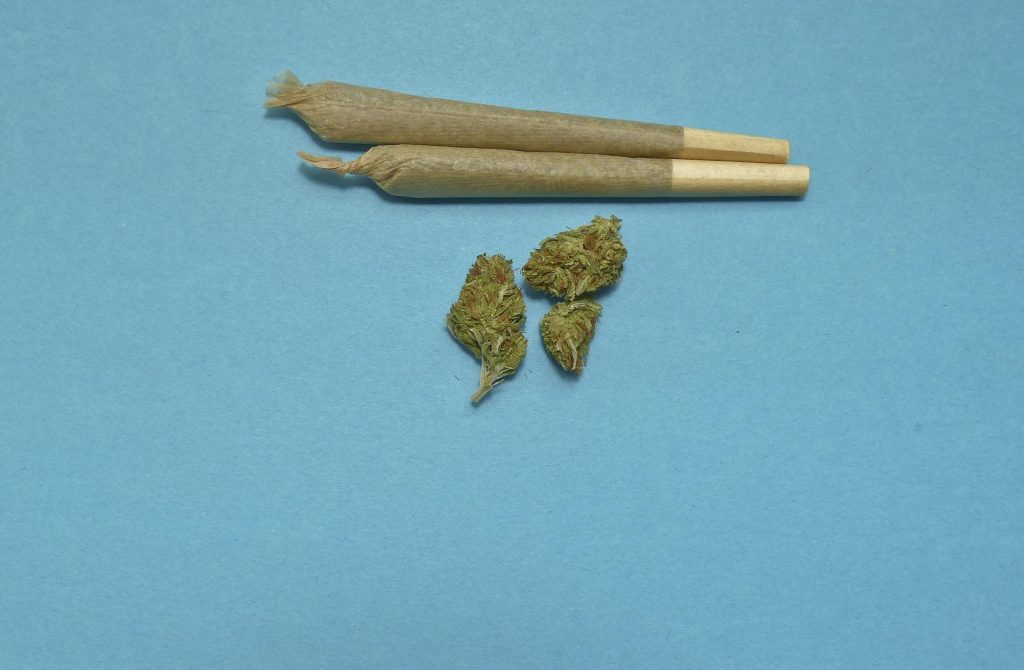
Cannabis was the most commonly used illicit drug in 2019, with 11.6% of Australians using it in the last 12 months. This was followed by cocaine (4.2%), ecstasy (3.0%) and non-medical use of pain-killers and opioids (2.7%). Use of cannabis, cocaine and ecstasy all rose between 2016 and 2019, as did the use of inhalants, hallucinogens, and ketamine, while the non-medical use of pain-killers and opioids fell over the same period.
While the use of cocaine and ecstasy in the previous 12 months increased between 2016 and 2019, use of meth/amphetamines remained stable (1.4% in 2016 and 1.3% in 2019). However, people who used meth/amphetamines continued to use them more frequently than people who used cocaine and ecstasy. Cannabis continued to be the most frequently used illicit drug, with 37% using it weekly or more often; this was followed by meth/amphetamine use with 17% using it at least weekly. This increased to 29% among those who used crystal/ice as their main form of meth/amphetamines. Very few people who used ecstasy or cocaine used it weekly or more often—6.7% and 4.5% respectively.

Rates of substance use are falling among younger generations
Compared with people their age in 2001, today’s young people are less likely to smoke, drink and use illicit drugs. This may be due to the young people of 2001 carrying on similar habits as they age, today’s young people having different habits from past generations, or a combination.
In 2001, people in their 20s were most likely to have used an illicit drug in their lifetime, but by 2019 it was people in their 40s. While rates of illicit drug use rose among older age groups over this period, rates remained stable for people in their 30s and fell for people under 30.
In 2001, people in their 20s were also the most likely to smoke daily, but in 2019 it was people in their 40s and 50s. Older people were also the most likely to drink alcohol daily in 2019, with the highest rates seen among people aged over 70 (12.6%). Just 1.2% of people aged 20–29 drank daily. Younger people are also now more likely to abstain from alcohol than they were 18 years ago. For example, the proportion of people in their 20s abstaining from alcohol increased from 8.9% in 2001 to 22% in 2019.
Cocaine use is at its highest level in almost 2 decades
In 2019, 4.2% of Australians had used cocaine in the previous 12 months. This is the highest proportion seen since 2001, and has risen from 2.5% in 2016. Increases were seen across all age groups (except 14–19 year olds), but the overall rise was mainly driven by men.
Men also drove an increase in rates of recent ecstasy use, particularly those aged in their 20s and 30s. After declining in recent years, ecstasy use was up in 2019, with 3.0% of Australians having used it in the previous 12 months (up from 2.2% in 2016). There has also been a shift in the main forms of ecstasy used, with capsules (33% in 2016 to 49% in 2019) now used more than pills/tablets (from 51% in 2016 to 34% in 2019).
Non-medical pharmaceutical use is down, driven by a fall in use of pain-killers
Between 2016 and 2019, the proportion of people using pharmaceuticals for non-medical purposes in the previous 12 months fell from 4.8% to 4.2%, falling from the second to fourth most commonly used illicit drug in Australia. This change has been driven by a reduction in the non-medical use of pain-killers and opioids, from 3.6% of Australians in 2016 to 2.7% in 2019. There has been a particularly notable fall in the proportion of people using codeine for non-medical reasons, halving from 3.0% in 2016 to 1.5% in 2019. This aligns with codeine being made a prescription-only medication in 2018.

Fewer Indigenous Australians are smoking or drinking at risky levels
Between 2010 and 2019, the proportion of Aboriginal and Torres Strait Islander people who smoked daily fell from 35% to 25%. Over the same period, the proportion who drank at a risky level on a single occasion at least monthly fell from 46% to 34%, as did the proportion who exceeded the lifetime risk guideline, from 32% to 19%.
After adjusting for differences in age, between 2010 and 2019, the proportion of Indigenous Australians who smoked daily declined from 34% to 27%; exceeded the single occasion risk guideline at least monthly declined from 39% to 35%; and exceeded the lifetime risk guideline fell from 30% to 20%.
Rates of illicit drug use remained fairly stable among Indigenous Australians, but rose for non-Indigenous Australians.
Smoking rates increase with socioeconomic disadvantage, but illicit drug use highest in the most advantaged areas
While smoking rates have fallen in all socioeconomic areas, the improvement has been greatest among people living in the most advantaged areas. In 2019, after adjusting for differences in age, the proportion of people living in the lowest socioeconomic areas who smoked daily was almost 4 times as high as the proportion of people living in the highest socioeconomic areas (18.1% compared with 5.0%).
On the other hand, compared with people in more disadvantaged areas, people living in the highest socioeconomic areas have the highest rates of recent drug use and are the least likely to have never used an illicit drug. Between 2016 and 2019, rates of recent illicit drug use rose in the highest socioeconomic areas, but remained relatively stable in the other areas.
Smoking and drinking rates are down among gay, lesbian and bisexual people
Between 2010 and 2019, the proportion of people who identified as gay, lesbian or bisexual who smoked daily fell from 28% to 16%. The proportion who drank at a risky level on a single occasion at least monthly fell from 45% to 38%, as did the proportion exceeding the lifetime risk guidelines, from 30% to 22%.
Over the same period, the proportion of gay, lesbian and bisexual people who had used an illicit drug in the previous 12 months remained similar (36% in 2010 and 40% in 2019), and the use of some drugs was much higher than among heterosexual people. After adjusting for differences in age, compared with heterosexual people gay, lesbian or bisexual people were 9 times as likely to have used inhalants in the previous 12 months, almost 4 times as likely to have used meth/amphetamines in the previous 12 months, and more than 2.5 times as likely to have used ecstasy.
Australians are increasingly supportive of cannabis use and most support pill-testing

In 2019, for the first time, more people said they supported the legalisation of cannabis than opposed it (41% compared with 37%). It was also the first time the proportion of Australians who supported cannabis being used regularly by adults was greater than the proportion that supported regular tobacco smoking (19.6% compared with 15.4%).
Almost 3 in 5 Australians (57%) supported potential drug users being able to test their pills or other drugs at designated sites. There has also been a shift towards education, rather than law enforcement, as the preferred strategy to reduce the use of illicit drugs—when asked where money should be spent, people allocated more funds to education than to law enforcement for the first time in 2019.
Between 2016 and 2019, there was also a decline in support for policies aimed at reducing the problems associated with excessive alcohol use. For example, support for reducing trading hours for pubs and clubs declined from 39% in 2016 to 31% in 2019. More people now oppose reducing trading hours for pubs and clubs than support it (40% compared with 31%).
Recent(a) illicit drug use, alcohol use and risk, and tobacco use, people aged 14 and over, 2001 to 2019 (per cent)
| Drug/Behaviour | 2001 | 2004 | 2007 | 2010 | 2013 | 2016 | 2019 |
| Tobacco | |||||||
| Daily smoker | 19.4 | 17.5 | 16.6 | 15.1 | 12.8 | 12.2 | 11.0# |
| Current smokers(b) | 23.2 | 20.7 | 19.4 | 18.0 | 15.8 | 14.9 | 14.0# |
| Alcohol | |||||||
| Recent use(c) | 83.6 | 84.3 | 82.9 | 80.3 | 79.1 | 77.7 | 76.6 |
| Lifetime risk(d) | 20.9 | 21.1 | 20.8 | 20.5 | 18.6 | 17.2 | 16.8 |
| Single occasion risk (e) | 29.7 | 30.0 | 29.3 | 29.0 | 27.0 | 25.7 | 24.8 |
| Illicit drugs (excluding pharmaceuticals) | |||||||
| Marijuana/cannabis | 12.9 | 11.3 | 9.1 | 10.3 | 10.2 | 10.4 | 11.6# |
| Ecstasy(f) | 2.9 | 3.4 | 3.5 | 3.0 | 2.5 | 2.2 | 3.0# |
| Meth/amphetamine(g) | 3.4 | 3.2 | 2.3 | 2.1 | 2.1 | 1.4 | 1.3 |
| Cocaine | 1.3 | 1.0 | 1.6 | 2.1 | 2.1 | 2.5 | 4.2# |
| Hallucinogens | 1.1 | 0.7 | 0.6 | 1.4 | 1.3 | 1.0 | 1.6# |
| Inhalants | 0.4 | 0.4 | 0.4 | 0.6 | 0.8 | 1.0 | 1.4# |
| Heroin | 0.2 | 0.2 | 0.2 | 0.2 | 0.1 | 0.2 | *<0.1 |
| Ketamine | n.a. | 0.3 | 0.2 | 0.2 | 0.3 | 0.4 | 0.9# |
| GHB | n.a. | 0.1 | *0.1 | 0.1 | *<0.1 | *0.1 | *0.1 |
| Synthetic Cannabinoids | n.a. | n.a. | n.a. | n.a. | 1.2 | 0.3 | 0.2 |
| New and Emerging Psychoactive Substances | n.a. | n.a. | n.a. | n.a. | 0.4 | 0.3 | *0.1# |
| Injected drugs | 0.6 | 0.4 | 0.5 | 0.4 | 0.3 | 0.3 | 0.3 |
| Any illicit(h) excluding pharmaceuticals | 14.2 | 12.6 | 10.8 | 12.0 | 12.0 | 12.6 | 14.1# |
| Pharmaceuticals | |||||||
| Pain‑killers/pain‑relievers and opioids(g,i) | n.a. | n.a. | n.a. | n.a. | n.a. | 3.6 | 2.7# |
| Tranquillisers/sleeping pills(g) | 1.1 | 1.0 | 1.4 | 1.5 | 1.6 | 1.6 | 1.8 |
| Steroids(g) | 0.2 | *<0.1 | *0.1 | 0.1 | *0.1 | *0.1 | 0.2 |
| Methadone or Buprenorphine(g,j) | 0.1 | *<0.1 | *<0.1 | 0.2 | 0.2 | 0.1 | 0.1 |
| Non‑medical use of pharmaceuticals(i) | n.a. | n.a. | n.a. | n.a. | n.a. | 4.8 | 4.2# |
| Illicit use of any drug | |||||||
| Any opioid(k) | n.a. | n.a. | n.a. | n.a. | n.a. | 3.7 | 2.8# |
| Any illicit(l) | 16.7 | 15.3 | 13.4 | 14.7 | 15.0 | 15.6 | 16.4 |
* Estimate has a relative standard error of 25% to 50% and should be used with caution. # Statistically significant change between 2016 and 2019.
- Used the specified drug in the previous 12 months.
- Includes people who reported smoking daily, weekly or less than weekly.
- Consumed an alcoholic drink in the previous 12 months.
- According to 2009 NHMRC guideline 1: On average, had more than 2 standard drinks per day.
- Derived from 2009 NHMRC guideline 2: Had more than 4 standard drinks on one occasion at least once a month.
- Included ‘designer drugs’ before 2004.
- For non‑medical purposes.
- Illicit use of at least 1 of 12 classes of drugs (excluding pharmaceuticals) in the previous 12 months in 2019. The number and type of drug used varied over time.
- Excludes over‑the‑counter medications such as paracetamol and aspirin.
- Did not include buprenorphine before 2007.
- Includes use of heroin, non‑medical use of pain‑killers/pain‑relievers and opioids or non‑medical use of methadone/buprenorphine.
- Used at least 1 of 16 classes of illicit drugs in the previous 12 months in 2019. The number and type of illicit drug used varied over time.
Notes
- Smoking status in 2010 has been revised. Trend data may not match previously published results.
- The calculation of drinking status and alcohol risk was updated for all years in 2019. Trend data may not match previously published results.
- In 2016, pain‑killer/pain‑relievers and opioids sections were combined into one section and references and questions about use of non‑opioid over‑the‑
counter drugs such as paracetamol and aspirin were removed. Data are not considered comparable to previous years.
- The NDSHS offers introductory text for each class of drug, including examples of the drugs included. Examples for hallucinogens, inhalants and New and Emerging Psychoactive Substances were changed in 2019, which may have affected trend results since 2016.
Reference: Australian Institute of Health and Welfare. (2020). National Drug Strategy Household Survey 2019. Drug Statistics series no. 32. PHE 270. Canberra AIHW. Pages vii – x.

